Data
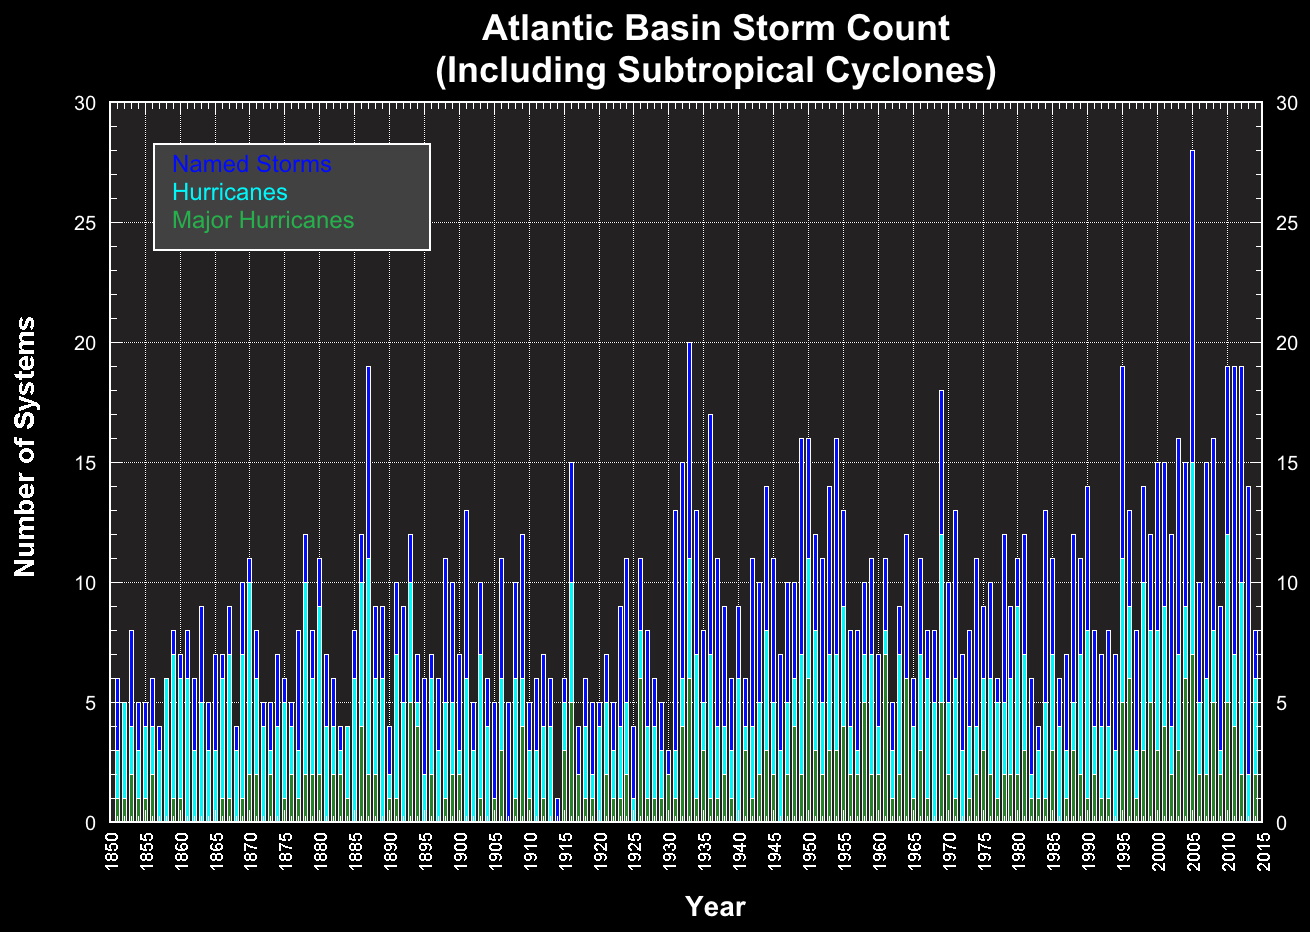
Figure. This image is hyperlinked to the Wikipedia page entitled; Atlantic hurricane
season. Hover over or click on the graph, for more detailed information on each date range.
Hurricanes form over over tropical or subtropical waters, beginning as a low pressure area (or tropical wave) that moves through the moisture-rich tropics, possibly enhanced by a pre-existing weather disturbance. Thunderstorms and warm oceans are fuel for hurricanes. The water to be at least 26.5 degrees Celsius and 50 meters deep to power the storm. High wind shear also helps the development of a storm. Even with all of these factors, a storm won’t always develop into a hurricane.
Warm ocean air rises into the storm, forming an area of low pressure underneath, as it moves westward across the tropics. The low pressure area sucks more air into the storm. This air then rises and condenses into clouds and thunderstorms. More heat is released to power the storm as the clouds precipitate.
Once a weather system reaches 74 mph wind speeds, it is classified a hurricane. “Hurricane” and “cyclone” are both rotating, storms that originate over tropical or subtropical waters and have closed, low-level circulation. The difference between a cyclone and a hurricane is that a cyclone develops mostly in the southern hemisphere and so rotates in a counter-clockwise direction, whereas a hurricane develops closer to the Northern hemisphere and rotates in a clockwise direction.
Conditions for a Hurricane
- Low pressure
- Warm moist tropical climate
- A thunder storm
- Percipitation
- High wind shear
- An ocean temperature of at least 26.5 degrees C
- Minimum depth of ocean floor 50 meters
Atlantic & Eastern Pacific Climatology
The Atlantic hurricane season runs from June 1st to November 30th. The Atlantic basin encompasses the Atlantic Ocean,
Gulf of Mexico and Caribbean Sea, whereas the Eastern Pacific basin extends to 140°W. The tables below are categorised
into the following important headings;
- Number: i.e. the number of storms and hurricanes seen up until that date
- Named systems: Tropical Storms that are severe enough to warrant categorisation
- Hurricanes: Even more severe weather systems
- Category 3 or greater: The most severe and least common storms
| Number |
Named systems |
Hurricanes |
Category 3 or greater |
| 1 | June 10 | June 26 | July 19 |
| 2 | June 25 | July 14 | Aug 19 |
| 3 | July 5 | July 29 | Sep 20 |
| 4 | July 14 | Aug 12 | - |
| 5 | July 22 | Aug 26 | - |
| 6 | July 30 | Sep 9 | - |
| 7 | Aug 7 | Sep 24 | - |
| 8 | Aug 15 | Oct 15 | - |
| 9 | Aug 24 | - | - |
| 10 | Sep 1 | - | - |
| 11 | Sep 10 | - | - |
| 12 | Sep 19 | - | - |
| 13 | Sep 28 | - | - |
| 14 | Oct 11 | - | - |
| 15 | Nov 5 | - | - |
Table 1. Progress of the average eastern Pacific season
(1971-2009). Date upon which the following number of events
would normally have occurred.
These tables shows how a typical hurricane season progresses in terms of the total volume of tropical systems and hurricanes produced throughout the year in the Atlantic and East Pacific basins. The tables consist of benchmark dates when a given number of hurricanes, tropical systems, or Cat 3 storms are generated.
| Number |
Named systems |
Hurricanes |
Category 3 or greater |
| 1 | July 9 | Aug 10 | Sep 4 |
| 2 | Aug 1 | Aug 28 | Oct 3 |
| 3 | Aug 13 | Sep 9 | - |
| 4 | Aug 23 | Sep 21 | - |
| 5 | Aug 31 | Oct 7 | - |
| 6 | Sep 8 | Nov 23 | - |
| 7 | Sep 16 | - | - |
| 8 | Sep 24 | - | - |
| 9 | Oct 4 | - | - |
| 10 | Oct 19 | - | - |
| 11 | Nov 23 | - | - |
Table 2. Progress of the average Atlantic season
(1966-2009). Date upon which the following number of events
would normally have occurred.