Magnetosphere
Finding online information on historical fluctuations of the geomagnetic field is more difficult
than you might think. There are a number of websites that offer uptodate real time information of local or
worldwide changes in the Earth's magnetic field, but they aren't much use, especially if you are interested
- as we are - in data going back further than say 48 hours. Among these is the
magntometer of University of Alaska, Fairbanks,
and the Aurora Service, which is an
ambitious homespun project originating out of Finland. Luckily, I came across a
website that provides raw,
unfiltered data of geomagnetic fields. Surprisingly, this information does not originate out of the United
States, with its advanced Space Program (you may have heard of NASA) and weather monitoring systems, but from
a state-run observatory at the
Swedish Institute of Space Physics, called the IRF. The IRF is integrated with a number of Swedish
Universities, including the very prestigious Uppsala University, which has contributed impressive theories
in terms of planetary physics and cosmology, in recent times.
But that doesn’t concern us right now, what does concern us are the fluctuations in the Earth’s magnetic
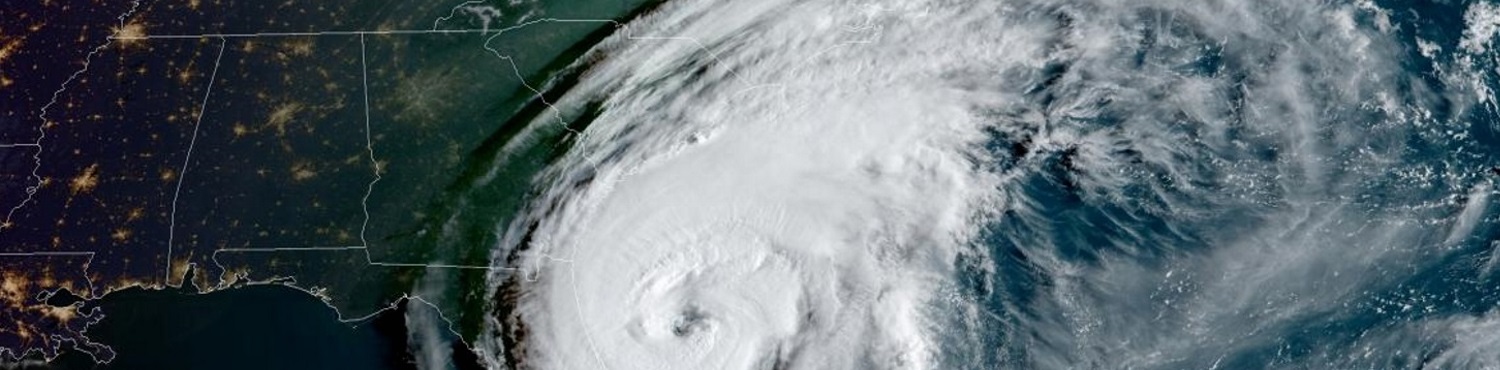
field in the days and weeks leading up to Hurricane Dorian making landfall. Why does that concern us?
Because if there was any man-made manipulation of the weather, especially one powerful enough to disrupt
and perturb a Category 5 hurricane, it will inevitably show up on a magnetometer measuring global geomagnetic
fluctuations. The IRF does state that its live data is unprocessed, which means that it could very well
contain man-made EMF signals, this would not be an issue for us, anyway, since we are looking for potentially
man-made signals. However, the backdated magnetographs are processed. Luckily for us again, this does not
matter, since it is unlikely that the IRF would be attempting to filter out such a large and sustained burst
of EMF radiation needed to control the path of a hurricane.
But where would such a sustained source of EMF originate from? Well that is the question. As far as official
channels are concerned, no such technology exists. And that is exactly why we can be sure that the physicists
at the IRF aren’t filtering it out of their data, if it were even possible to do so. But just because the
technology, on the official level, is said not to exist, does not mean that it never existed. The last known
facility capable of disrupting the weather was HAARP (High Frequency Active Auroral Research Program) and was
primarily funded by the US Air Force, the US Navy and DARPA. It used low-frequency radio waves to heat the
ionosphere to potentially alter weather patterns and to disrupt ballistic missiles. Some even theorised that
such an array could be used to create earthquakes. But the US military discontinued its research there in about
2014, leaving it in the hands of our friends the University of Alaska, Fairbanks. Given the success of the
facility, it is prudent to assume that the US military have built a newer, more secret and much more powerful
version of HAARP, although this has never been confirmed.

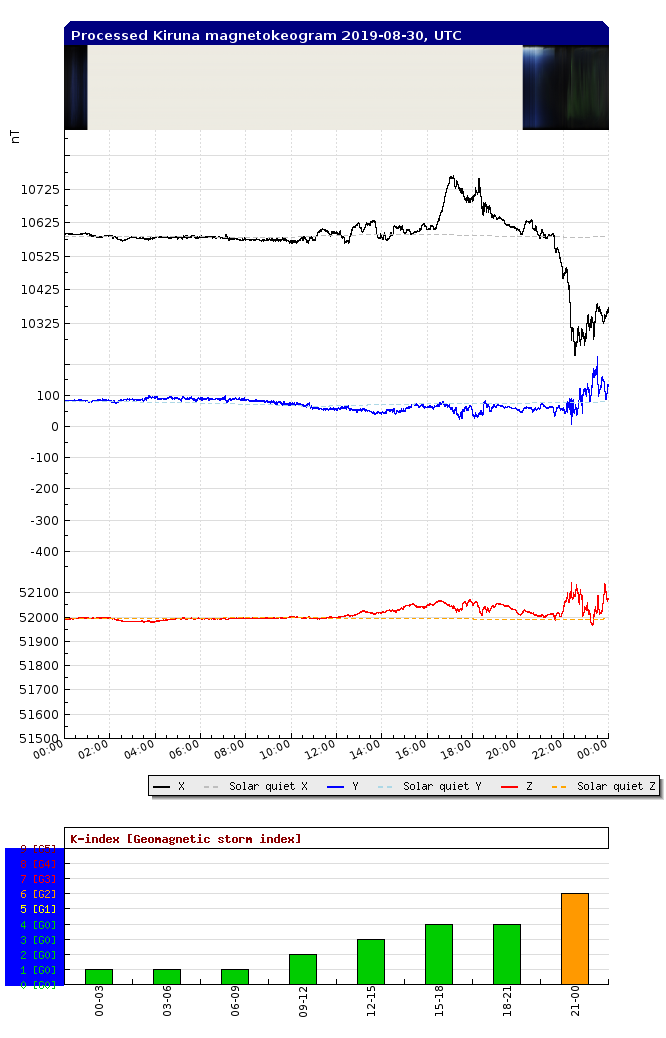
Left. Processed kiruna magnetogram 2019-08-31. Right. Processed kiruna magnetogram 2019-08-30
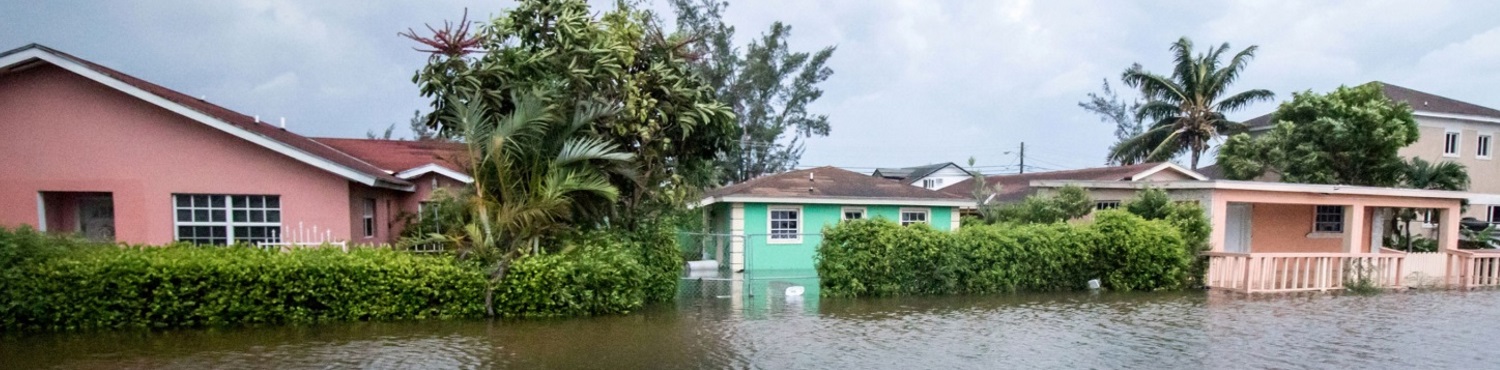
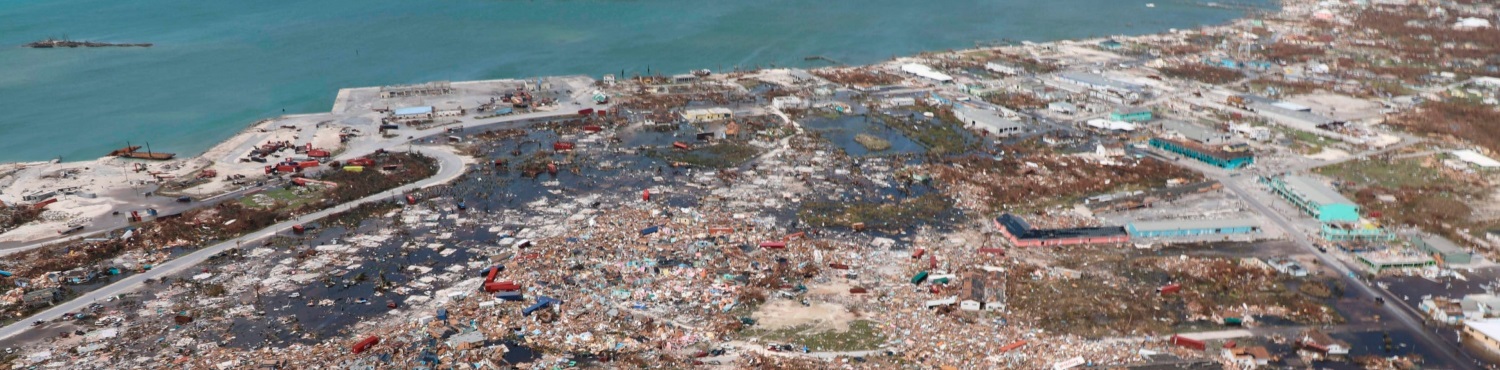
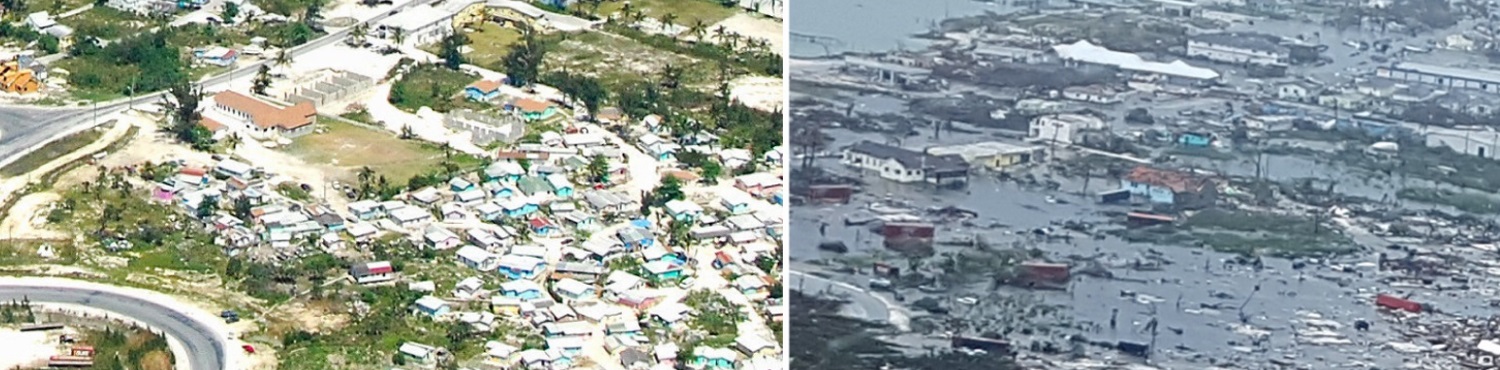
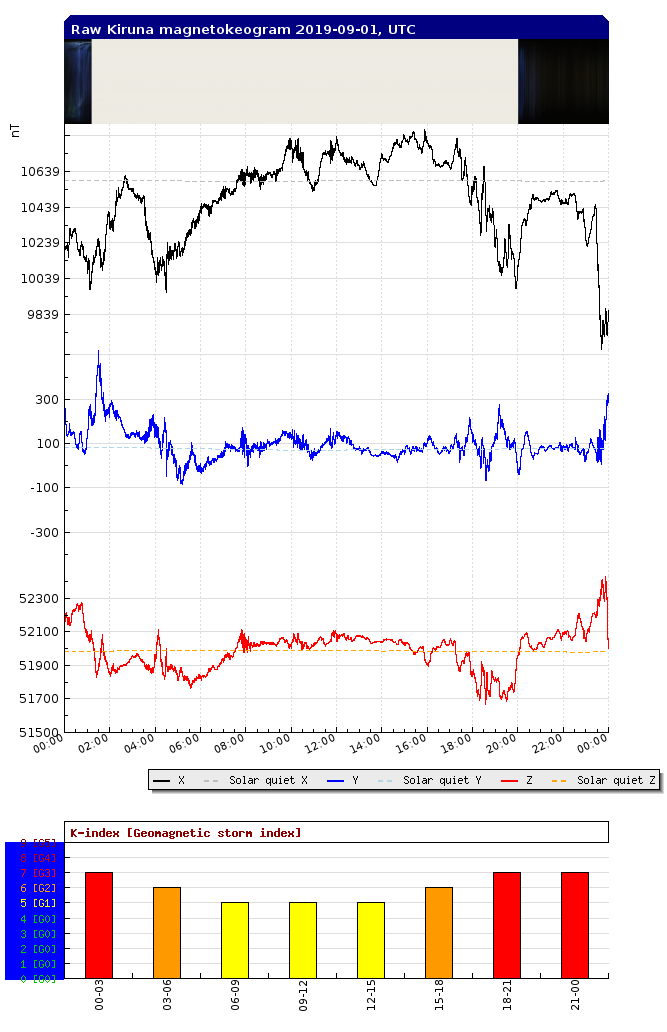
If we look at the magnetometer data from 30 and 31 August 2019 (above), during the same period when Hurricane Dorian was ramping up into a dangerous Category 4, we see a distinct rise in EMF radiation. The disturbance becomes much greater by 1 September (see below), when the hurricane intensified into a Cat 5 hurricane and this disturbance remains in place for the next two days. Interestingly, this is the period we are most interested in, as these are the dates when Dorian stalled over Abaco Island and the Bahamas.
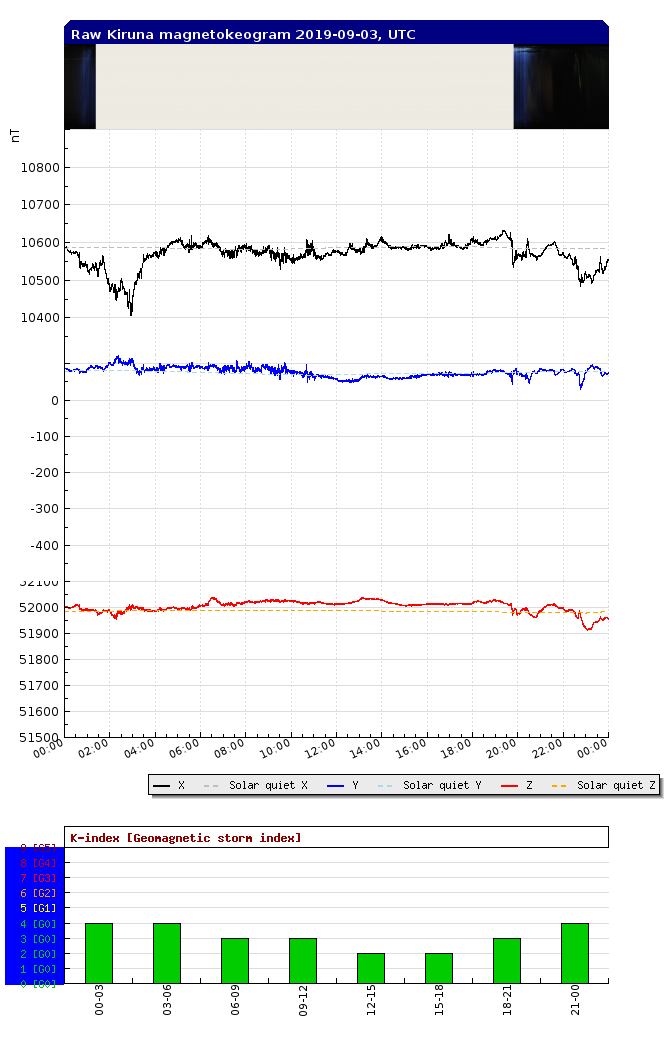
Image 1. Raw kiruna magnetogram 2019-09-01
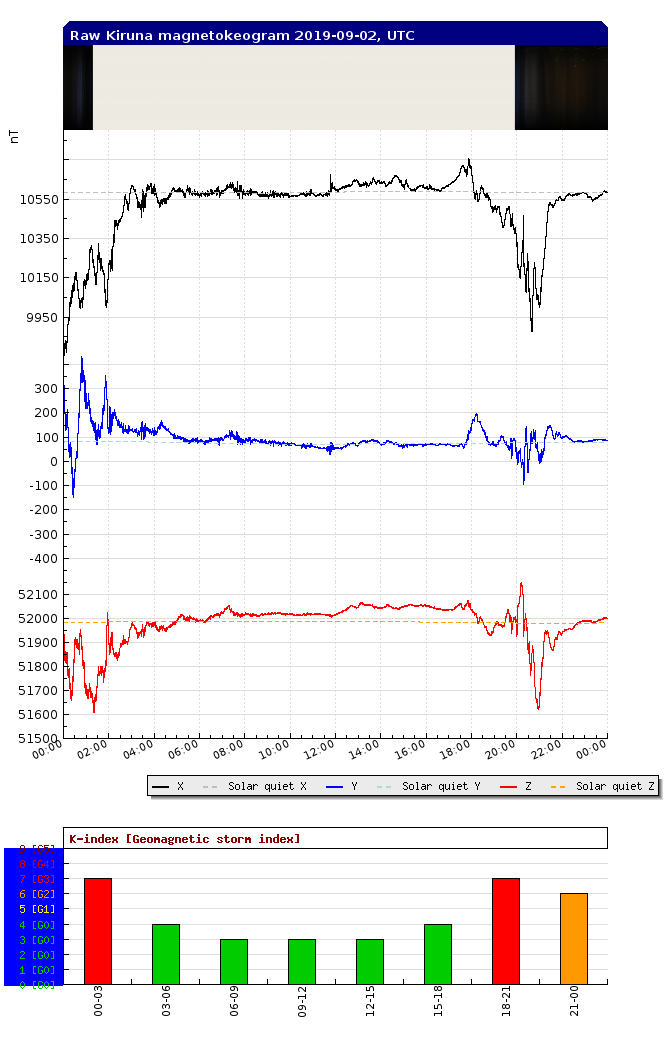
Left. Raw kiruna magnetogram 2019-09-02. Right. Raw kiruna magnetogram 2019-09-03.
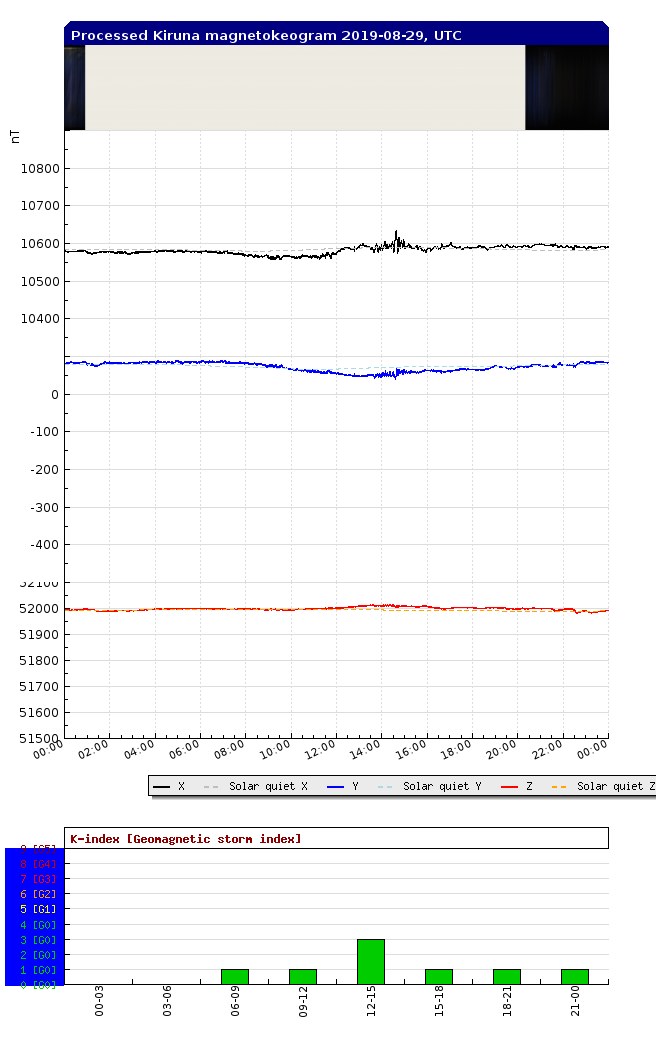
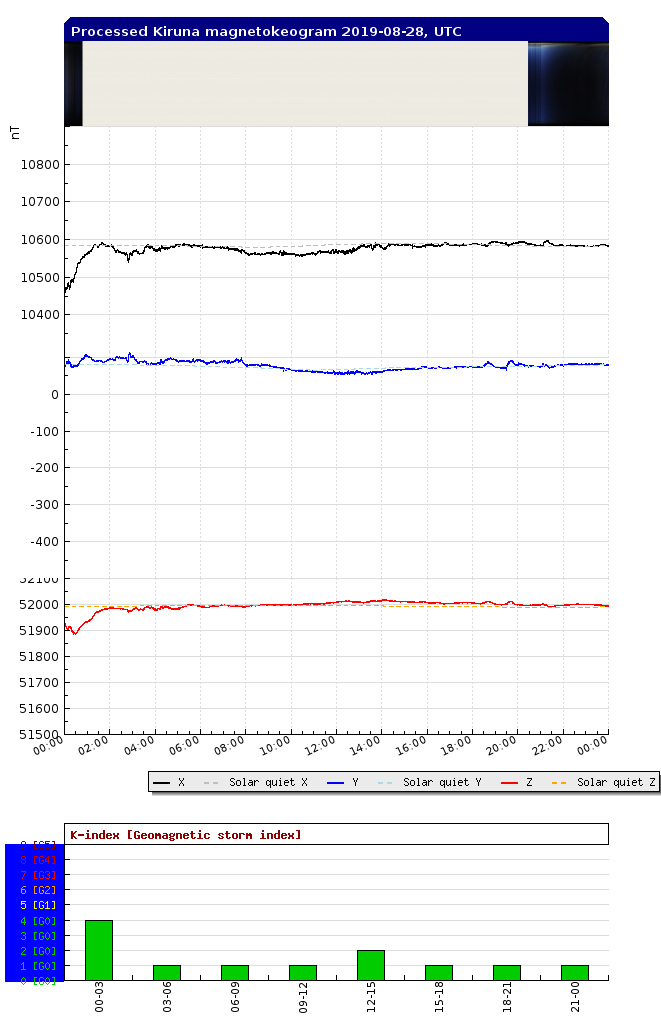
Compare this to the period prior to 30 August (below) and we see that the magnetosphere was unusually quiet and stable. While fluctuations like those above are not uncommon in the magnetosphere, it is interesting that they should coincide so closely with the storm itself.
Left. Processed kiruna magnetogram 2019-08-29. Right. Processed kiruna magnetogram 2019-08-28.
Incredibly, then it looks like we can find more evidence for the crazy conspiracy theory that a secret US military project was involved in manipulating Hurricane Dorian, than we can for the equally crazy idea that humans are manipulating the weather through Climate Change. We could go even further, if we were able to match the frequency of the magnetosphere to the path of the storm itself.
So that is exactly what I did.
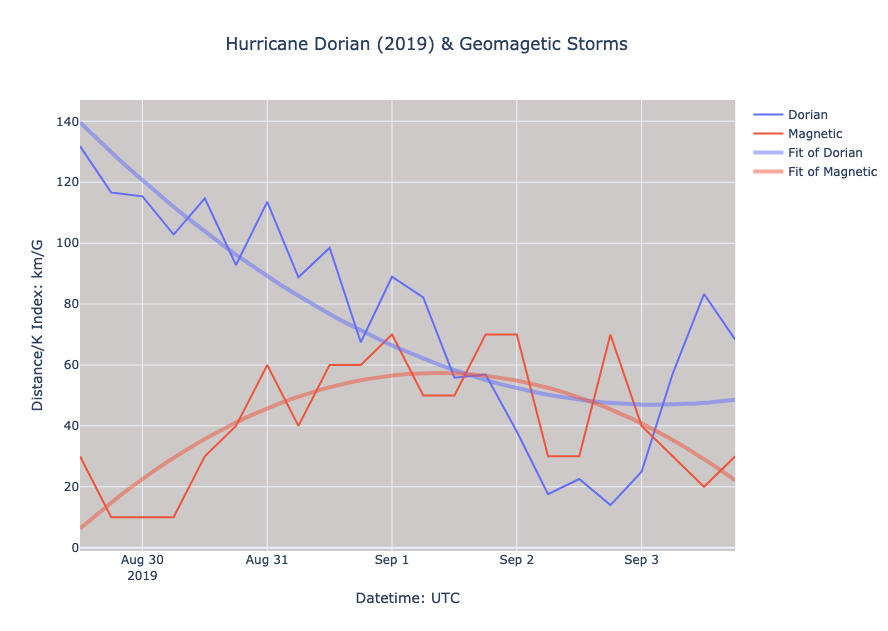
This graph shows variations in the forward speed of the hurricane, from the period of 29 August to 4 September 2019. As the storm gathered in intensity, its speed slowed considerably. This is not uncommon in large hurricanes. What is interesting is when we overlay the geomagnetic data from the IRF, we see an inverse relationship between the intensity of the geomagnetic field and the forward speed of the hurricane. The data from the IRF is taken from a set of values, known as the K-index, which is the Geomagnetic Storm Index and ranges from 0 to 9. I've multiplied this scale by a factor of 10, in order to make the trends more visible, but this doesn't change the data in any meaningful way, as the scale itself is a proportional representation.
In order to make this correlation even more apparent, I used a curve fitting algorythm to fit a quadratic curve to both traces. The curves reveal an indisputable inverse relationship and shows that as the geomagnetic storms change intensity, the forward speed of the hurricane follows suit. If indeed this is evidence of government manipulation of the weather, then it suggests a high degree of control.
In some sense, this exercise is proof of how you can take any sufficiently short data set to prove whatever argument you like. Climate alarmists are routinely guilty of this, by only analysing recent climate data that proves their case and ignoring the wealth of historic data that doesn't. While that is the case, it is hard to prove that the above two graphs don't represent evidence of a government funded weather manipulation event. Ironically, most climatologists and alarmists would contest that such technology even exists and criticise any claims to the contrary as "conspiracy theory". How could pathetic humans ever hope to manipulate something, as large and as complex as the weather, they say? This is even more ironic, when we consider that this is precisely what they are suggesting is happening with Global Anthropogenic Climate Change. What they want you to believe is that several government agencies with a combined budget of trillions of dollars, the will and the expertise is not capable of altering the weather, but driving your children to school in the morning will.
That is, of course, assuming that you haven't decided to foregoe having children in order to save the planet from Anthropogenic Climat Change. But that is another story entirely...